
What are they, how do Bollinger Bands work and how to use them in your trading strategy?
Bollinger Bands are considered to be one of the most important and best-functioning tools in the landscape of technical analysis indicators. In particular, they are part of the volatility indicators of the market but also perform other important functions including identifying the overbought/oversold phases and the price fluctuation range. Indeed, Bollinger Bands are a technical means used to evaluate the volatility of stock or index prices.
Developed by John Bollinger in the 1980s, this tool is based on the idea that prices tend to move within predictable ranges defined by so-called “bands”. Due to their characteristics, Bollinger bands allow you to understand how financial assets will move, anticipating possible trend reversals and more.
Bollinger Bands offer traders the possibility to create a winning strategy and above all effective. If used properly they can, in fact, generate reliable market entry signals.
In this article, in collaboration with the experts of XTB, we will see how how Bollinger Bands work, how they can be understood and how they can be used to make informed trading decisions.
What are Bollinger Bands
The Bollinger Bands are one of the most used indicators in the field of technical analysis on the markets. As mentioned before, researcher John Hurst’s theory is the basis of Bollinger Bands.
According to this theory, “trading envelopes” gravitate around the price of a financial instrument, calculated with a percentage that fluctuates between 3% and 4%. In these “envelopes” it is possible to develop important trading ideas signaled by the Bollinger bands.
The Bollinger bands are nothing more than a 20-period moving average of the price of the instrument being analyzed plus the standard deviations of the average which form the “pockets” mentioned earlier. To obtain the envelopes it is necessary to calculate two averages by shifting one of them downwards or upwards by a certain percentage.
This indicator was created to measure market volatility, but then takes on far more interesting characteristics. By combining Bollinger Bands with other indicators, trend reversal and best buy/sell moments can be derived.
Many traders believe that Bollinger Bands offer the best and most reliable trading signals.
Bollinger Bands consist of three lines: a simple moving average (SMA) and two bands at a predefined distance from the SMA. The upper band is called the “upper Bollinger Band” and is at a distance equal to twice the standard deviation of the SMA above it. The lower band is called the “lower Bollinger band” and is located at a distance equal to twice the standard deviation of the lower SMA. The SMA is typically calculated over a 20-day period, but can be adjusted to suit your needs.
How Bollinger Bands work
Bollinger Bands consist of three lines: one simple moving average (SMA) and two bands at a predefined distance from the SMA. The upper band is called the “Upper Bollinger Band” and is at a distance equal to twice the standard deviation of the SMA above it. The lower band is called the “Lower Bollinger Band” and is located at a distance equal to twice the standard deviation of the lower SMA. The SMA is typically calculated over a 20-day period, but can be adjusted to suit your needs.
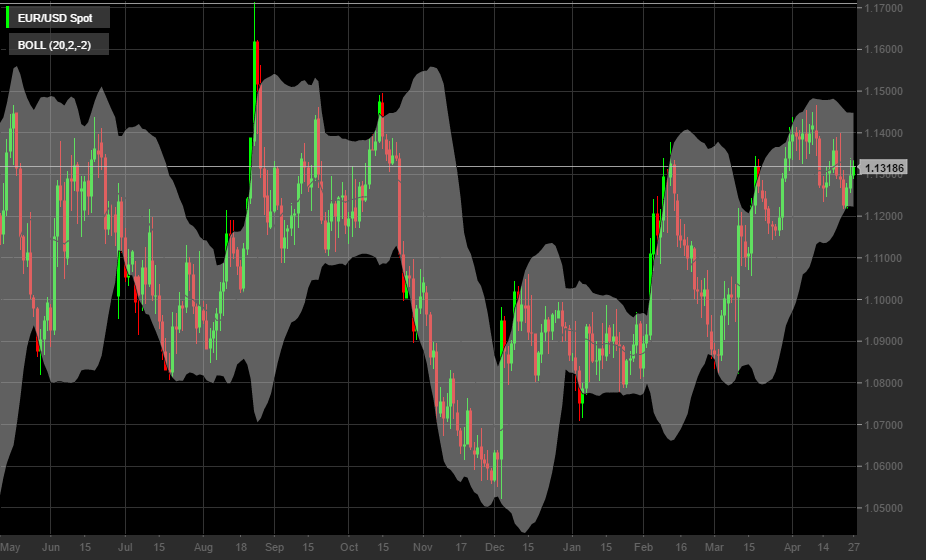
Bollinger Bands are used to assess the price volatility of stocks or other assets:
- when volatility is low, the bands get closer;
- when volatility is high, the bands move apart.
This means that as the bands widen, the price is more likely to move above one or the other, and as the bands narrow, the price tends to stay within them.
How Bollinger Bands are obtained
Bollinger Bands are made up as follows:
- a linear moving average over N days, which represents the central line;
- the upper band is obtained from a linear moving average to which 2 times the standard deviation is added;
- lower band is obtained from a linear moving average from which 2 times the standard deviation is subtracted.
These curves are obtained exclusively from the price history of the financial asset in question. By superimposing the price curve on these three lines, it is possible to have a figure of the price trend over time and to visualize the area in which prices are contained.
Methods of using Bollinger Bands
Trading software builds Bollinger Bands themselves based on predefined or user-chosen characteristics. In particular, the bands look like this:
The upper band and lower band function as dynamic support and resistance areas. In essence it is as if they indicate phases of overbought and oversold.
Furthermore, when there is a very busy session the bands expand, while in moments of low volatility the bands contract.
It is important to note that the price always tends to move back towards the middle line of the bands. This is what is called the Bollinger bounce.
In particular, when the price gets close to the upper band and the hole the market can be considered in overbought phase, signifying an imminent bearish trend reversal. In this case it will be appropriate to open a sell position if the price promptly falls within the upper band.
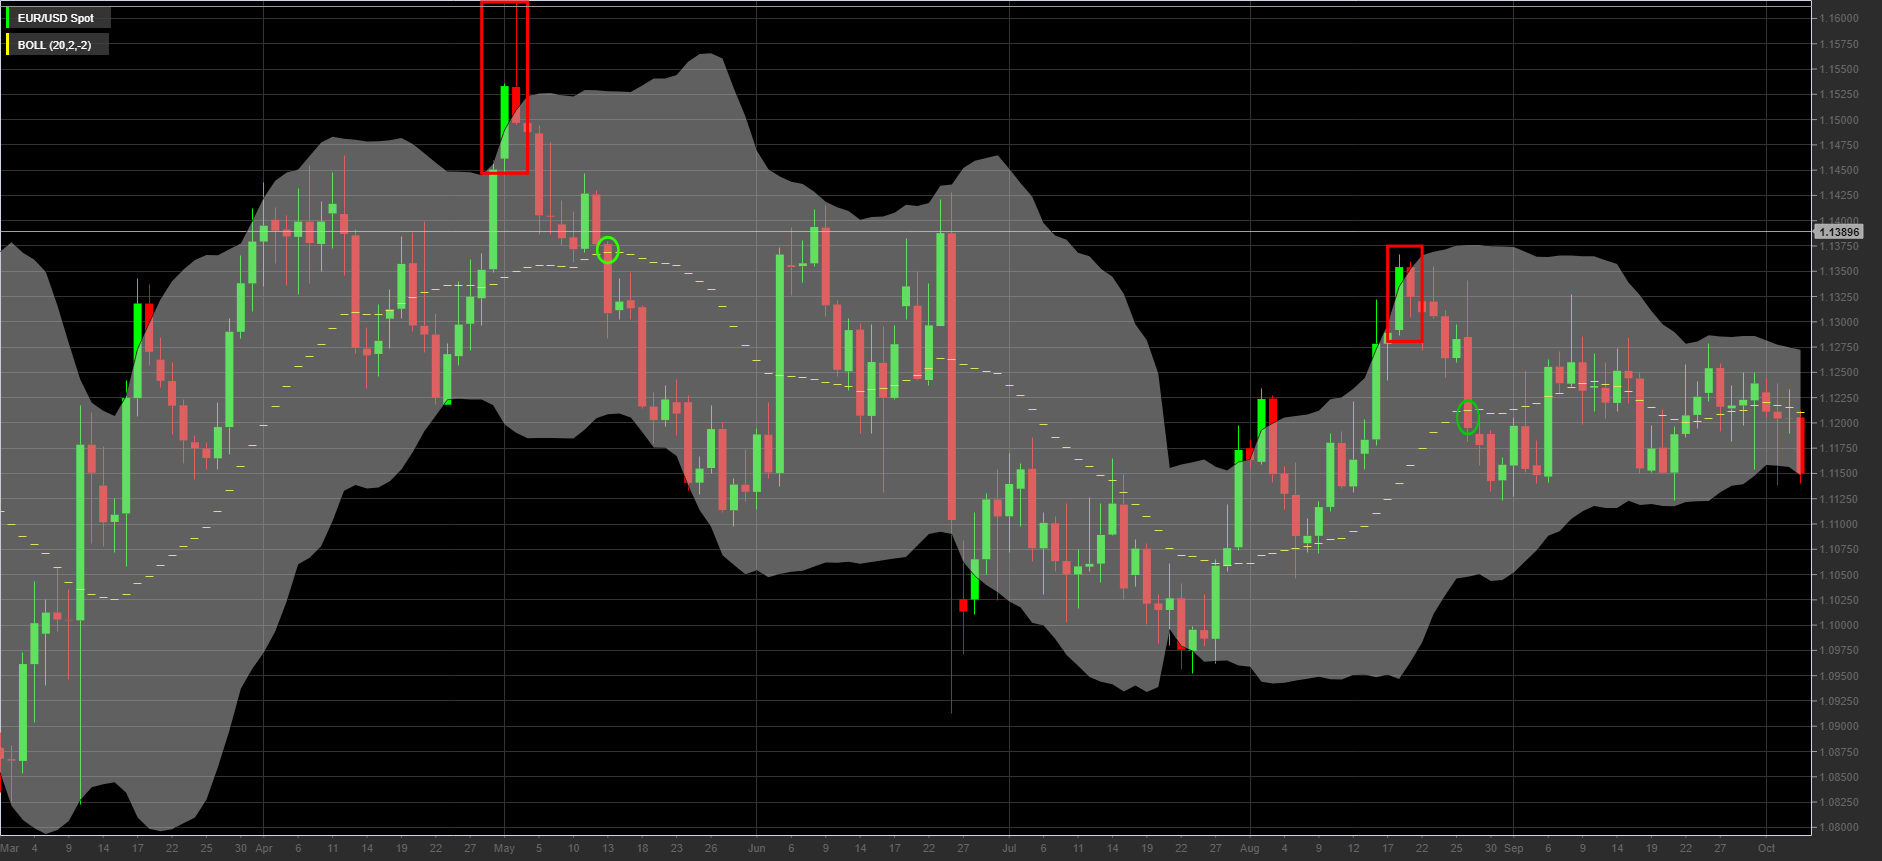
Conversely, when the price gets close to the lower band and the hole the market can be considered in oversold phase, signifying an imminent bullish trend reversal. In this case it will be appropriate to open a buy position if the price promptly falls within the lower band.
In both cases the target must be placed on the center line.
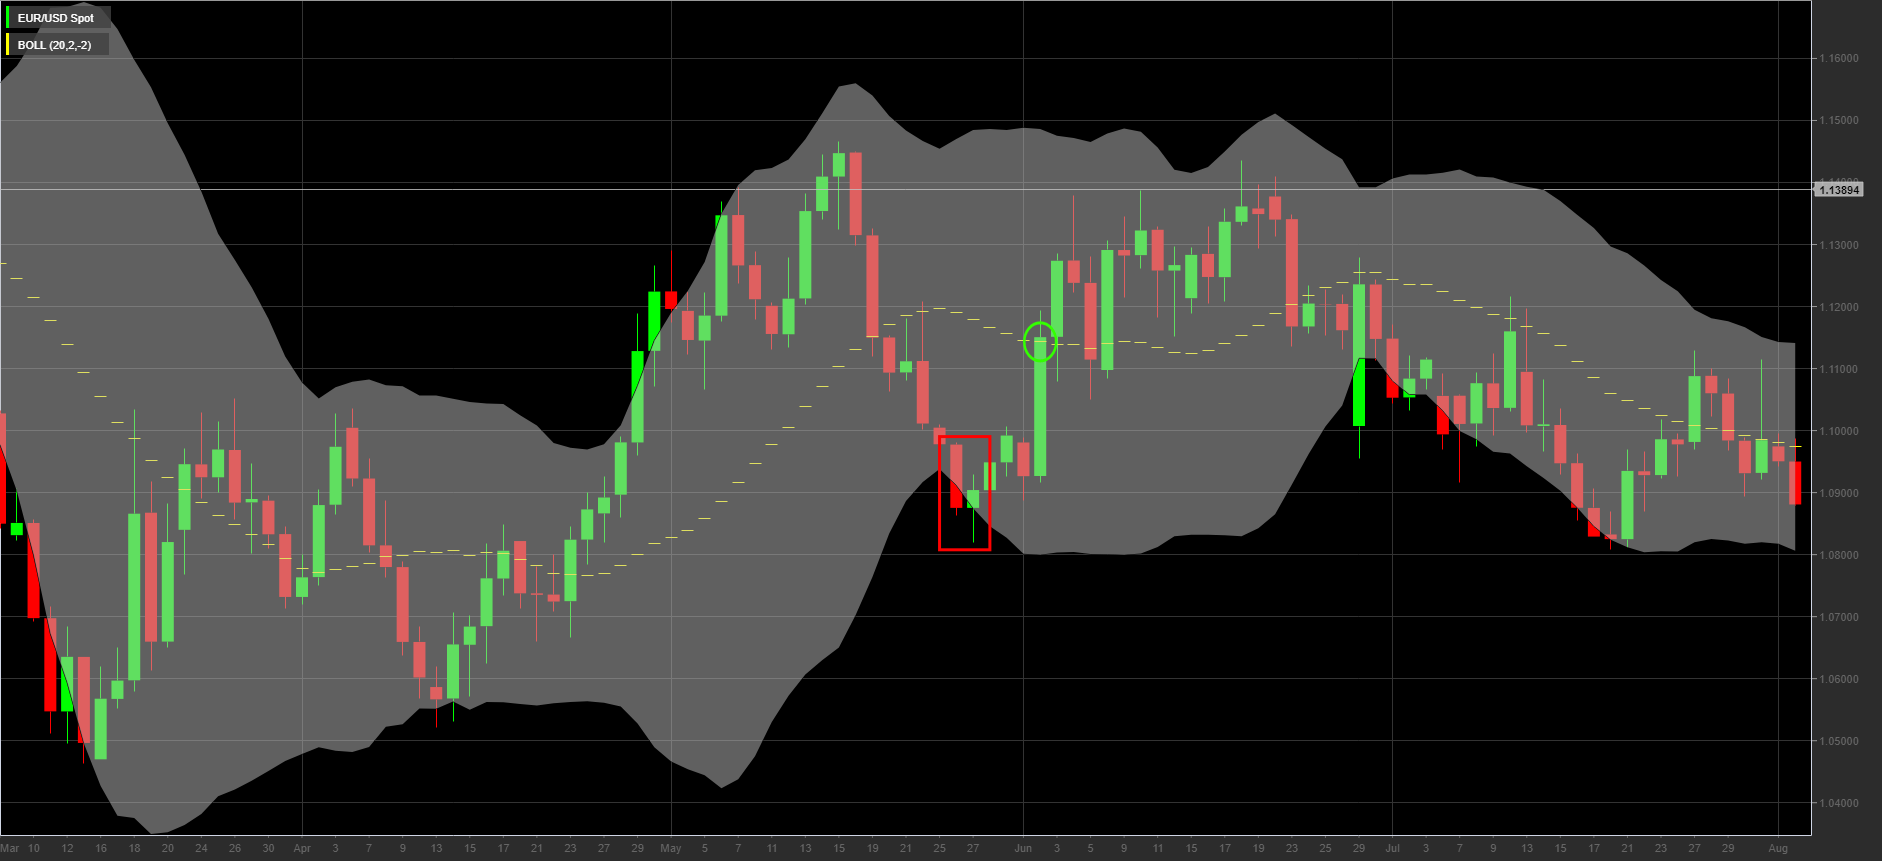
Otherwise, the moments of narrowing of the bands can be exploited to identify the best moment to place a breakout order.
In this case, which is called squeeze, there are two different situations:
- the candles break the upper band which indicates a phase of uptrend. After breaking the upper band, the price usually continues to rise;
- the candles break the lower band which indicates the arrival of a bearishtrend. As in the previous case, after the breakout, prices continue to fall.
Identify trend reversal points with Bollinger Bands
Bollinger Bands can be used to identify trend reversal points. When the stock reaches the upper range, it indicates that the price is overvalued and could go down. On the other hand, when the price touches the lower band, it suggests that the price is undervalued and might go higher.
Quantify the strength of the trend with Bollinger Bands
Bollinger Bands can also be used to identify the strength of price action. If the stock price is within the band, it indicates a relatively weak trend. However, when the price crosses one of the bands, it indicates a strong trend, up or down.
Define support and resistance levels with Bollinger Bands
Bollinger Bands can also be used to identify price support and resistance levels. The support level is the price to which the stock price is trying to fall, and the resistance level is the price to which the stock price is trying to rise.
Support and resistance levels can be identified when a stock approaches one of the Bollinger Bands and bounces. These two levels can be used by the trader to set a stop loss or sell the stock price.
Using Bollinger Bands in combination with other tools
Bollinger Bands can be used in conjunction with other technical indicators. The most commonly used indicators are the Stochastic Oscillator and the Relative Strength Index (RSI).
The Stochastic Oscillator is an indicator that compares a stock’s closing price to its price range over a period of time. When the Stochastics crosses the line above 20, it shows a buy signal, and when the Stochastics crosses the line below 80, it shows a sell signal.
The RSI measures the relative strength of a stock relative to its past performance. A sell signal is given when the RSI rises above the 70 line and a buy signal is given when the RSI falls below the 30 line.
The Story of Bollinger Bands

Bollinger Bands take their name from their creator John Bollinger, an American financial analyst, who formalized them inspired by John Hurst’s theory. In the book “Bollinger on Bollinger Bands”, published in 2002, Bollinger explains his theory of Bollinger bands.
In 1980 Bollinger became an independent financial operator and shortly after joined the Financial News Network of which he was chief financial analyst for seven years.
It was in this period that he began to conceive Bands and the other theories proposed in his books. In 2005 he also managed to win the Lifetime Award for Outstanding Achievement in Technical Analysis, for the great contribution he made to technical analysis and its advancement. Bollinger then founded Bollinger Capital Management, of which he is the president, an investment firm that manages money and makes investments based on forecasts from technical analysis.
Limitations of Bollinger Bands
Bollinger Bands can be a very useful tool for traders, especially when used in conjunction with other technical analysis tools. Note, however, that Bollinger Bands are not an accurate indicator of future price movements. This tool should only be used as a guide for investors to make informed trading decisions.
Always remember to consider the risks: Please note that information or research based on historical data does not guarantee future performance or results. Any opinions, research, analyses, prices or other information provided under the heading of general market commentary do not constitute investment advice. Investing is risky. Investors should always consider their level of risk and time horizon before using this trading strategy.
XTB is a world-class regulated investment broker, with a global presence in over 13 countries. This financial intermediary is regulated by major financial regulatory institutions. The XTB platform offers access to more than 5,800 financial instruments - both real stocks and ETFs, as well as CFD-type derivative instruments, as well as access to comprehensive and free training.
In collaboration with XTB Original article published on Money.it Italy- 2023-02-21 14:44:00. Original title: Bande di Bollinger: cosa sono e come funzionano. Guida completa-


