
US stock markets are experiencing a period of high volatility and uncertainty. While the US volatility index (the VIX) continues to grow, the decrease of the big tech is extending, directly influencing the S&P 500 itself, point reference for the retail public. The hypercapitalization of tech companies on the US stock market has created a substantial situation of imbalance that worries many experts. Given this sectoral and geographic rotation, does it make sense to be concerned about a particularly deep contraction? Here’s a look at some very important data and indicators.
What is happening in the US market?
The CBOE VIX index, known as the US investor fear index, reached its highest value since April 2023. This increase in expected volatility on the S&P 500 index is closely linked to the political instability that is shaking the United States. The failed attack on Trump and Joe Biden’s withdrawal from the presidency left room for a new candidate who is rapidly gaining consensus, putting global stock markets under pressure.
Several indicators are highlighting this situation. US stocks are slowly moving back towards their 50-day and 200-day moving averages, suggesting increased selling in the market. This is demonstrated by the fact that the share price of FAANG companies (Facebook, Amazon, Apple, Netflix, and Google) is contracting by 10% compared to recent highs, significantly contributing to the decrease in the S&P index 500. It is no coincidence that high beta stocks, which tend to move in a more volatile manner than the market, show a greater contraction than low beta stocks, which are less volatile. This indicates that the market contraction is hitting large caps the most, as evidenced by the decline in big caps. Likewise, in July, the ratio of value to growth stocks increased significantly, confirming that the contraction, although clearly visible on the S&P 500, is not across the entire market, but only in the technology company segment.
This phenomenon is further confirmed by the increase in the spread between the traditional S&P 500 and the S&P 500 equal weight, which weights all the companies in the index equally, showing a different behavior of the stocks with greater capitalization compared to those with smaller capitalization.
US market collapses due to earnings season? Not exactly
The earnings season is not providing clear signals to the markets. Although it started very well with banking stocks presenting positive and better-than-expected results, not everything is rosy for other technological companies.
For example, Tesla reported disappointing results in Q2 2024, with earnings falling short of analysts’ expectations. The company has faced production and sales problems, exacerbated by an uncertain economic environment and growing competition in the electric vehicle sector. Google also showed signs of a slowdown, with revenue growth lower than expected. The difficulties of these companies reflect a broader trend of uncertainty in the technology sector, which has led to a significant correction in stock prices.
<leggianche|articolo=2294>
Hypercapitalization of tech stocks: what can happen on the market?
The hypercapitalization of American companies in the technology sector, favored by the boom in artificial intelligence, has created a worrying situation of imbalance. These companies, characterized by high P/E ratios and high earnings expectations, have gained significant control over the overall performance of the market, represented by the S&P 500 index. The growing popularity of passive investment tools, such as the ETF, has shifted a good portion of the positions in these companies into the hands of retail investors. This phenomenon has fueled a demand cycle more influenced by expectations than by economic fundamentals.
The concept of cyclic rotation, which is normally a healthy aspect of the market, could turn into a devastating ripple effect for global stock markets. A sudden drop in confidence in big tech could trigger massive sell-offs, leading to a rapid market contraction.
Is the S&P 500 overvalued?
The S&P 500’s current forward-looking price/earnings ratio is approximately 21, higher than the index’s historical average of approximately 16. This indicator suggests that the index may be overvalued relative to its historical levels. High valuations are often a sign of potential corrections ahead, especially amid political and economic uncertainty.
Despite this, investment banks frequently revise their target prices for the S&P500 index upwards. For example, Goldman Sachs raised its target price for the S&P 500 to 5,600 points, UBS Global Research recently increased its target to 5,400 points, and Barclays also revised its target price to 5,300 points, with a possible scenario optimistic of 6,050 points, should big tech earnings continue to exceed expectations.
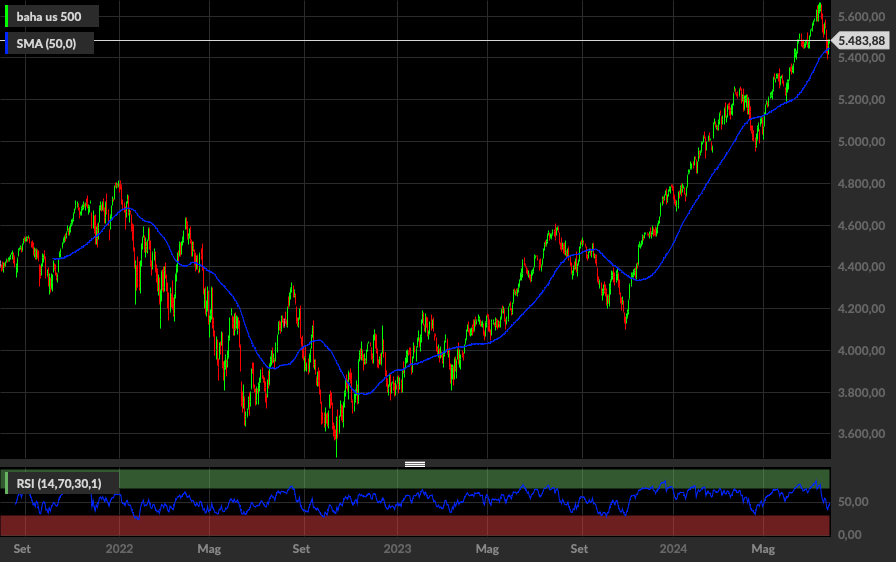
Technical Analysis of the S&P 500 Index
From a technical perspective, the S&P 500 is showing signs of weakness. The index is currently near its 50-day and 200-day moving averages, a crucial level that often acts as support or resistance. If the index were to fall below these averages, it could indicate further downside potential.
Furthermore, momentum indicators such as the RSI (Relative Strength Index) are signaling a possible oversold condition. An RSI below 30 suggests that the index may have been oversold, which could lead to a technical rebound in the near term. However, high volatility and political uncertainty may continue to negatively impact the index.
DISCLAIMER
The information and considerations in this article should not be used as the sole or primary basis for making investment decisions. The reader retains full freedom in his own investment choices and full responsibility in making them, since he alone knows his risk propensity and his time horizon. The information contained in the article is provided for informational purposes only and its disclosure does not constitute and should not be considered an offer or solicitation to public savings.
Original article published on Money.it Italy- 2024-07-29 15:03:31. Original title: Azioni USA a un punto di svolta. Cosa aspettarsi ora?-


