
The price of the S&P 500 is reaching technical levels previously considered impossible by many investors. Breaking the threshold of 5,000 points is a significant event in the index’s history, reflecting strong market optimism. Observing the S&P 500 chart, curiosity arises regarding the duration of this bullish trend, which began in mid-2022.
Will we see a record-breaking Bull Run like what happened in 2020?
To look for an answer, it might be useful to analyze some graphs and indicators.
Graphical analysis of the S&P500 expresses solidity
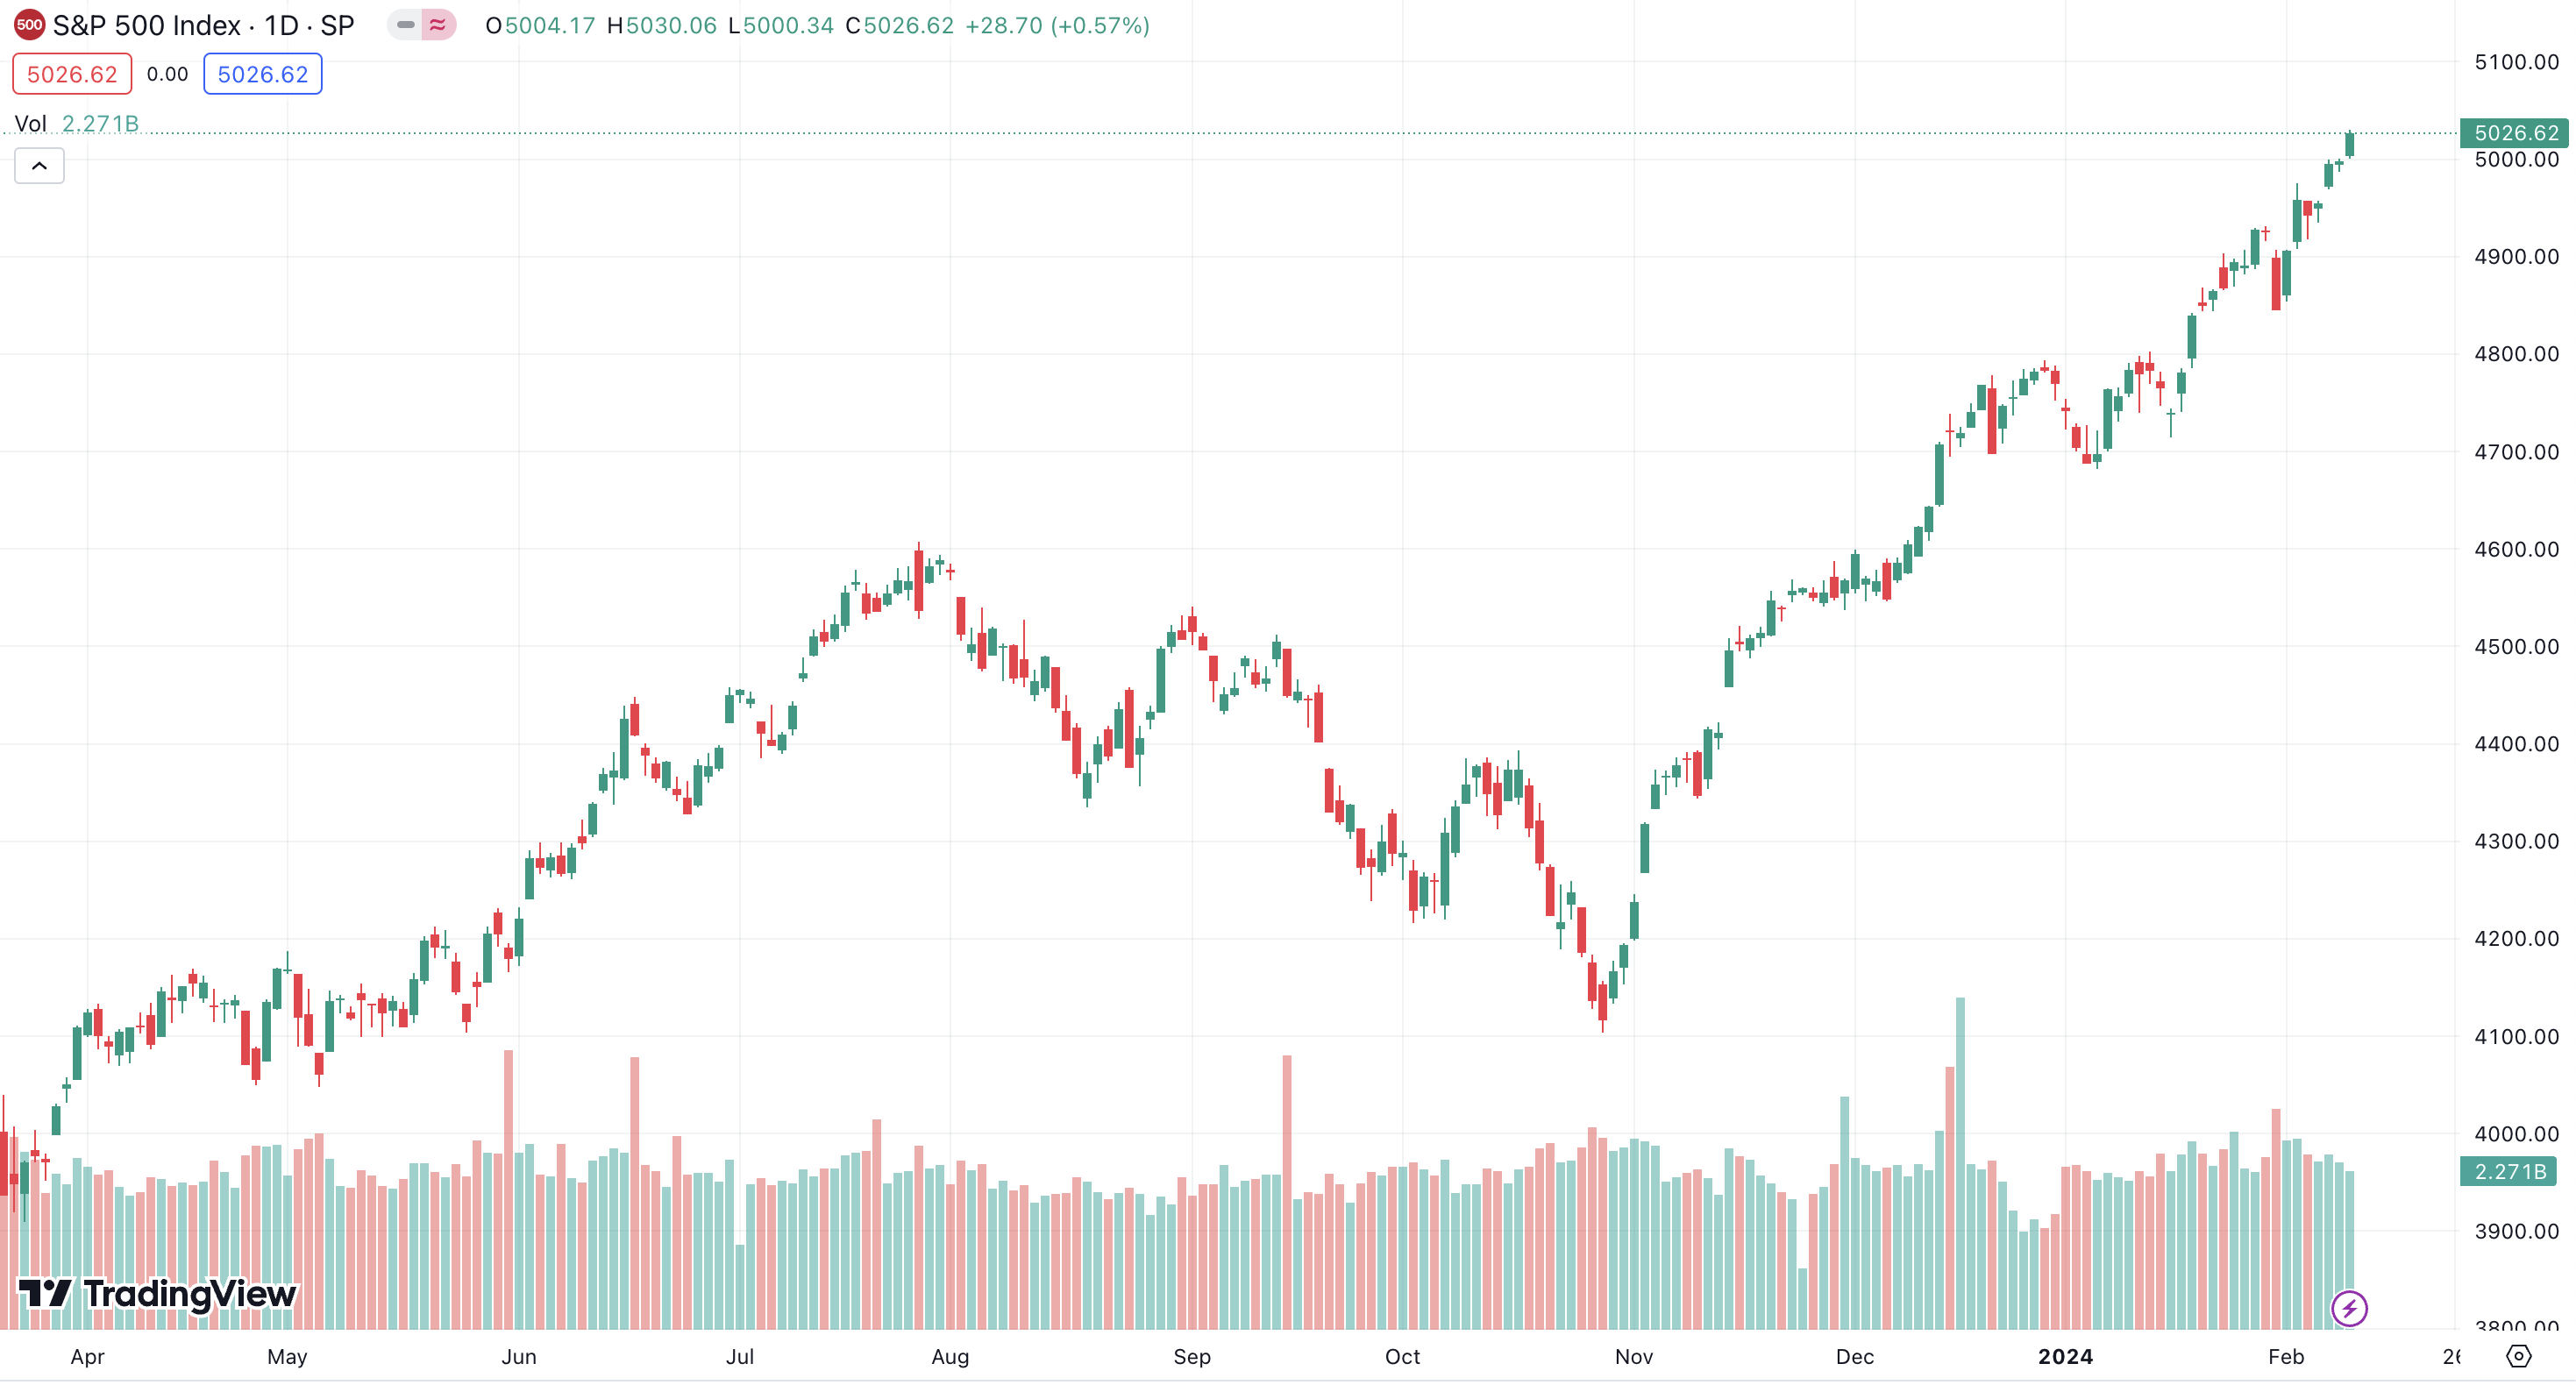
The performance of the S&P 500 approached the fateful 5,000 points, setting a new record in the history of the index. Driven by enthusiasm for positive economic data, declining inflation, and interest rates that appear to have stopped rising, the main US stock market index is in a phase of significant charting extension.
The 5,000 points represent a threshold never previously reached by the index, and therefore cannot be considered resistance in the traditional sense, but take on an important psychological value. Exceeding this level, especially on a weekly basis, should be interpreted as a real break of resistance, despite the absence of specific graphic references. This is particularly evident in volumetric analysis, as can be observed in the futures market.
However, in 2024, markets have changed and a breakout must be interpreted intelligently: once exceeded, the 5,000 points must be maintained, to avoid creating a destabilizing technical environment that could lead many traders and investors to close their positions or to protect profits, thus triggering a correction of variable size, depending on the “plot twist”.
It is worth noting that we witnessed similar fears in 2020. At the time, the S&P 500 index exceeded the annual highs, rising to a level of 3,500 points after the post-pandemic collapse. This triggered a contrarian movement, followed by a rapid recovery, and the start of a historic bull run. On the contrary, the surpassing of 4,000 points occurred linearly, and the S&P continued rapidly towards the conquest of new historical highs.
<leggianche|articolo=1528>
A Look at Market Stress Indicators
An important category of indicators to monitor carefully to contextualize the rise of the index concerns those relating to market stress. To make more technical sense, we consider these indicators on broader timeframes. The S&P 500 Stocks Above 200-Day Average index measures the percentage of stocks within the S&P 500 index that are above their 200-day moving average. Reaching the 70% level signals a significant graphic extension, already observed in the past, in February and July 2023, close to short market corrections. The range with the highest statistical frequency for a trend reversal is found at 90%. It is no coincidence that reaching 70% often coincides with reaching 90% in the same indicator but in the lower range of the S&P 500 Stocks Above 50-Day Average, which refers to the 50-day moving average.
Another indicator considered in this type of analysis is the volatility index of the S&P 500, the VIX: this index approaches the level of 10 points, a very significant minimum, touched for the last time at the end of 2023 and, before then, only in 2020, before the outbreak of the COVID-19 crisis. This is a significant indication of market tranquility and directionality, achieved only on rare occasions. As a result, the performance of the S&P 500 has been particularly regular, so much so that in the last 16 weeks, only one has been negative and to a minimal extent compared to the others. This sequence of positive sessions is unusual in the history of the index. Looking at the Heikin Ashi chart, to find a red weekly candle you have to go back to October 2023, and this week’s candle looks poised to close with a large gain and in green.
Furthermore, the market has reached a level of extreme greed. CNN’s Fear & Greed index reached 72 points, approaching the EXTREME GREED zone. This growing greed among market participants is understandable given the graphic reach of stock markets
Will we see a new bull-run like in 2020?
If examined exclusively from a technical point of view, numerous similarities emerge: in both situations, we started from a marked collapse of the markets, and in both contexts, the S&P was characterized by a notable graphic hyperextension. Nonetheless, this did not prevent the start of a bull run, which was difficult to predict at the time, given the apprehension about the repercussions of COVID-19 on the state of the global economy.
A significant difference occurs, however, in the monetary field: while in 2020 the Federal Reserve implemented a money printing policy, bringing the growth rate of the M2 monetary mass to record levels, in 2024 the policy plans The Fed’s restrictive monetary policy marks a clear divergence from the past and no interruptions to this strategy have been announced.
For this reason, many analysts shift their attention to the Fed’s monetary policy choices, because they could also deprive the market of the fuel it needs and has needed in recent years to rise at these record rates.
Original article published on Money.it Italy- 2024-02-09 18:00:00. Original title: S&P500 su livelli mai visti: presto nuova bull-run come nel 2020?-


