The S&P 500 halts the rally and continues with slight declines, alerting investors. Will we see new declines soon?

The accommodative tone maintained by Powell since the end of 2023 has fueled the so-called "everything rally" in the financial markets. However, recent economic data released by various US statistical agencies has raised questions about future monetary policies. Based on these new expectations, the market has slowed its momentum: the S&P 500 ended last week lower after a long series of positive sessions and had an unpromising start to the current week.
Is it reasonable to expect a contraction in US stock market indices? A look at the S&P 500.
What interrupted the uptrend of the S&P500 index?
The unemployment rate fell to 3.7%, inflation for 2023 is confirmed at 3.1%, above analysts’ expectations of 2.9% and the Productivity of the country remains fairly in line with last year. Faced with this evidence, the so-called "everything rally" was temporarily interrupted. This is because the data shows a more resilient trend compared to the prospects highlighted by the various statistical bodies and the Federal Reserve.
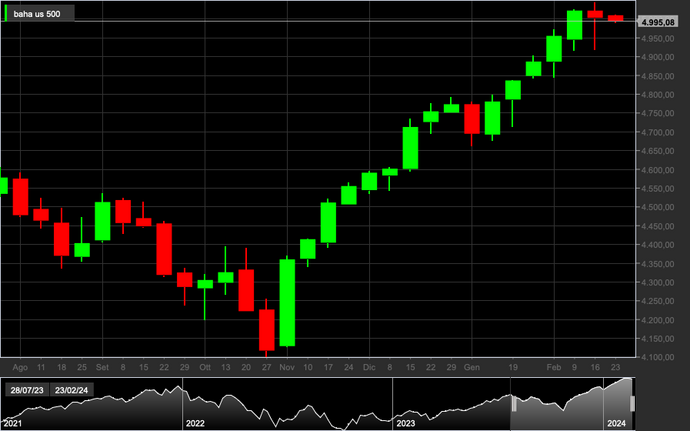
And this is how the S&P500 interrupts the 16-week record rally, drawing a first, albeit small, red candle on the Weekly timeframe candlestick chart.

- S&P 500 1W
- Source: Teletrader.com
What is the neutral rate of the US economy?
The question of the neutral rate of the US economy therefore becomes delicate, with a wide debate on which rate is actually capable of maintaining economic balance.
In 2020, monetary policymakers estimated the neutral rate, R-star, to be between 0.4% and 0.8%, given the Fed’s 2% inflation target. The most recent projections indicate an increase, placing R-star between 0.5% and 1%, with real rates of at least 3.5%. Raphael Bostic, president of the Atlanta Fed, claims that "the neutral rate grew between 2.5% and 3%," including 2% inflation.
If this were true, expectations of a massive rate cut would have been misinterpreted by the market.
It is important to remember that although rates have continued to fall progressively towards zero over the past decade to stimulate the economy, this measure was considered extraordinary and not the norm. Following this logic, the trend in rates could be oriented more toward the search for balance than zero.
Will S&P500 companies be able to afford debt refinancing costs?
Many traders and investors think that 2025 will be the make-or-break year, as many companies, especially the smaller ones in the index, will have to refinance their debt. This particularly concerns companies in the most credit-dependent sectors, such as Real Estate. Online these companies are referred to as "zombies" because if interest rates remain unchanged until 2025, many of them could find themselves in difficulty. However, if the Federal Reserve reaches a rate deemed neutral before 2025, these concerns may prove unfounded.
Although recent economic data has led the market to revise its expectations, this has not yet translated into a significant contraction in prices. A gradual increase in Treasury yields is also being observed in the bond market, accompanied by strong capital inflows, which have mitigated the decline in relative prices.
Will this disruption fuel traders’ profit-taking?
The risk of generalized profit-taking, also involving the S&P 500, is not excluded from market considerations. From a technical point of view, the index has reached an important overbought level, and many market indicators signal a maximum zone. The volatility index VIX shows a slight increase, and the prices of US indices have significantly moved away from their average. These signals could encourage profit-taking, causing a break in the trend. Furthermore, the FEAR & GREED index is starting to signal levels of extreme euphoria, mainly driven by the surge in prices in the most speculative markets, such as that of cryptocurrencies.
A first moment of confirmation could come with the publication of the quarterly results of Nvidia, the true great protagonist of the run of the US indices. Confirmation of the upward trend in Nvidia’s profits would provide an important indication of the trend of the current technology sector and justify, at least in part, the marked surge in expectations linked to the S&P 500 itself.
S&P500: a look at the chart
From a technical point of view, we have been in bullish territory since mid-2023, when the so-called "Golden Cross" occurred between the 200-period moving average and the 50-period moving average. Since then, the moving averages have continued their march into bullish territory, maintaining a substantially linear trend. Currently, the chart shows a lot of strength, and the moving averages show no signs of changing direction, remaining well oriented upwards, despite the presence of two red candles on a weekly timeframe.
Furthermore, by changing the periods of the moving averages on a daily timeframe (50 and 25), no bearish signal is detected. This underlines how the last two weeks of trading do not represent a technical moment of significant importance compared to the surge recorded by shares previously. Therefore, it may still be premature to speak with certainty about a correction.
Original article published on Money.it Italy 2024-02-20 11:36:36. Original title: L’S&P500 frena la corsa. Correzione in vista?


