Google’s rally does not stop and overwhelms the resistance at $151 (highs of 2021). This next bullish signal has a 95% chance of success.

Google shares have a 95% chance of rising 45% after breaking 2021 highs at $151. Since the beginning of the year, the stock - among the most important in the S&P 500 - has gained over 11%, demonstrating strength even when other sectors seem to be struggling.
The definitive breakout of a long-term resistance can signal a further bullish movement. In the case of Google, exceeding area 151 could unfold the positive effects of a well-known technical analysis pattern. Let’s take a closer look at this promising prospect.

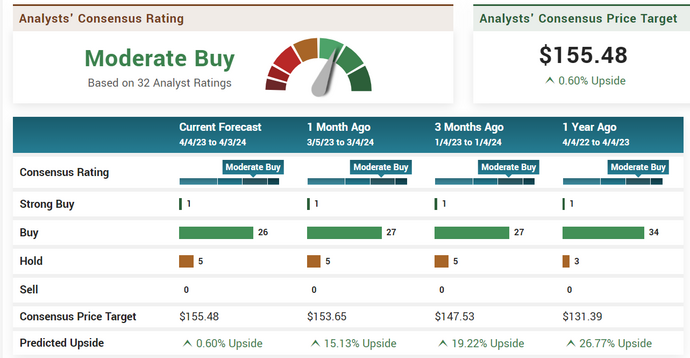
- Google target price
- Source: Bezinga.com
Google target price
Google’s target price is often discussed by analysts at major investment banks.
Recently, Wells Fargo revised its outlook on Alphabet, Google’s parent company, reducing its stock price target to $141 from $144, while maintaining a rating of equal weight. This review was mainly influenced by the lawsuits faced by Alphabet lately, which resulted in extraordinary expenses and a significant impact on the company’s financial models. To name a few, Alphabet paid approximately $350 million in February in a class action lawsuit related to Google Plus and a $270 million fine imposed by France.
These events, although considered extraordinary expenses, have been carefully considered in the revised financial models that support the new target price.
While maintaining an “Equal-Weight” rating, which suggests a neutral stance on the stock’s near-term trend, the price target adjustment reflects the financial implications of the company’s recent agreements and operational changes.
According to other analysts, however, the stock has a target price of $175, with an "outperform" rating. The company has a market capitalization of $1.93 trillion, a P/E ratio of 26.37, a PEG ratio of 1.39, and a beta of 1.05.

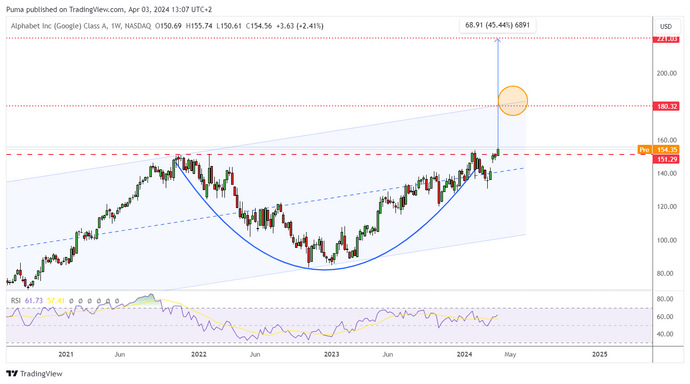
- Google’s weekly graph
- Source: Tradingview
Graphically, Google shares are moving within a channel that rises from the lows of 2020, whose references are currently positioned at 100 dollars and 180-185 dollars. Stabilization of prices above the 150 area would allow us to look with confidence at the test of the high side of the channel, at around 185 dollars. Different matter, below area 142 the risk of seeing retreats towards the first critical supports at around 130 would increase.
The Cup and handle pattern

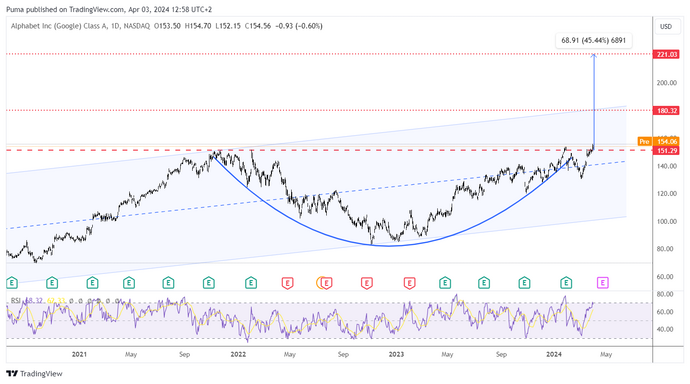
- Alphabet’s graph: the cup & handle pattern
- Source: Tradingview
The Cup and Handle pattern is a widely recognized chart pattern in technical analysis, known for its high reliability. It develops in two distinctive phases: the "cup" and the "handle". The “cup” phase is formed with a downward price movement, followed by an upward rally that ends approximately at the starting level. This creates a U or “cup” shape. Next, the “handle” phase occurs when the price retreats lower again, usually within a 5-20% range and near the bottom of the cup, before resuming its uptrend.
According to research, the Cup and Handle pattern features an impressive 95% success rate in bull market phases. This high success rate makes it an attractive option for investors looking for trading opportunities with calculated risk.
Advantages and disadvantages of the Cup and Handle pattern
Advantages:
- Easy to identify: The Cup and Handle pattern is visually intuitive, with the shape of the cup and handle resembling a teacup with a handle on the right side. This clarity makes it easily recognizable even for less experienced traders.
- Risk Management: Provides clear points for stop-loss and take-profit levels, allowing investors to manage risk effectively.
- Volume Confirmation: Volume confirmation during pattern formation provides additional validity to the trading signal.
Disadvantages:
- Subjective interpretation: The model may be subject to different interpretations, which could lead to false signals or missed opportunities.
- Requires Experience: Although relatively easy to identify, correctly interpreting the pattern and translating it into profitable operations requires experience and skill.
- Long-term trend: Pattern formation can take a long time, requiring patience from investors.
| DISCLAIMER The information and considerations in this article should not be used as the sole or primary basis for making investment decisions. The reader maintains full freedom in his own investment choices and full responsibility in making them, since he alone knows his risk propensity and his time horizon. The information contained in the article is provided for informational purposes only and its disclosure does not constitute and should not be considered an offer or solicitation to the public for savings. |
Original article published on Money.it Italy 2024-04-06 18:01:00. Original title: Questo titolo ha il 95% di probabilità di salire del 45%


