The world of trading has many useful technical indicators, from the moving average to the RSI. In this article, we’ll look at the top 5 indicators for online trading.

All traders, from novice to experienced, will have to use a technical indicator at least once in their career. Over the years, however, so many technical indicators have been developed that it might be confusing to understand which one is best. In this article, we’ll take a look at the 5 best technical indicators for online trading.
The goal of a technical indicator is to provide valid information on the chosen trade. The right combination of indicators tells the investor when to enter a trade and when to exit, or if it might be better to wait a bit longer in order to achieve maximum yield.
So, let’s see 5 of the best technical indicators available on most online trading platforms.
What makes a technical indicator good?
Each online trader usually has its own indicator of choice. Some can see an amazing trade only by looking at the RSI, while others understand where the market is going only by looking at the 50-day moving average.
Ultimately, it’s all a matter of experience. There are different layers to what each indicator is telling to the trader, and only through continued use one’s able to exploit its full capabilities.
However, there are 5 indicators that are generally considered the best ones, that even the most experienced traders use on a daily basis.
leggi anche
How to invest in Bitcoin

1. Moving averages
The most commonly used indicator in technical analysis is the moving average. The moving average corresponds to the average price of a predefined period of time and the term "moving" indicates the fact that the average is dynamically recalculated at each chart update according to the timeframe used.
In technical analysis, the crossing of moving averages is often used to identify entry or exit signals on the market or to understand the price trend at the time of the analysis.
The crossing of the averages can be double or triple, depending on the number of averages that are used on the graph at the same time. In general, there is a tendency to cross moving averages with short (20 periods), medium (60 periods), and long-term (200 periods) time ranges. The signal given by the crossing of the moving averages is considered reliable on medium-long timeframe, therefore from the daily upwards.
A bullish crossing occurs when the short-medium term averages, after cutting the long average, are above it. Conversely, in the case of a bearish signal, we will have the short and medium-term averages which cut the long-term average from above, positioning themselves permanently below it.
The signals given by the crossing of the moving averages are generally to be validated with other indicators such as the RSI or the ADX to allow a better generation of signals.
Moving averages are also often used as psychological price thresholds, indicating graphic levels of support and resistance which in this case are called dynamic support or resistance.
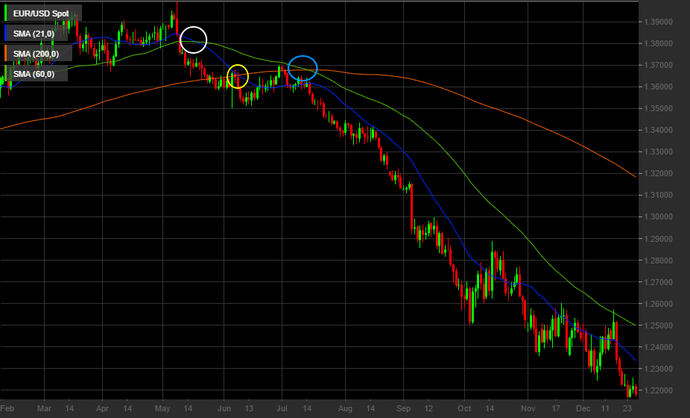
From the following graph, it is possible to see how on a daily graph a downward crossing of the 20-day moving average with the 200-day moving average corresponds to a drop in price in the short term while the subsequent crossing with the short-term average corresponds to the of a lasting downward trend.
2. Relative Strength Index (RSI)
The Relative Strength Index (RSI) is among the most used indicators in technical analysis due to the precise signals that the indicator is capable of generating thanks to its statistical nature.
The calculation of the RSI is in fact based on the correlation between "positive" and "negative" days which results in an indicator with values between 0 and 100. The oversold area corresponds to levels below 30, while the overbought area corresponds to the area above 70. The neutral zone is around the value of 50.
When the RSI is in the overbought area, or is about to enter it, it indicates a bullish phase of the price, vice versa when it is in the oversold area, the indicator suggests a bearish phase.
A prolonged standstill in the oversold or overbought values of the indicator generally indicates a possible trend reversal especially if accompanied by graphic divergences, i.e. when the trend of the graph is not reflected in the values indicated by the RSI.
The RSI indicator is generally not used alone but is accompanied by the MFI (Money Flow Index) which is none other than the volume-weighted RSI (if the Broker allows the use of statistics).
In case of impossibility of using the MFI, the RSI is often accompanied by the ADX or the crossing of moving averages.
In the graph below it is possible to see how the RSI has followed the trend of the Euro-Dollar exchange rate, moving towards the overbought and oversold areas in the cases of rising and falling respectively of the EurUsd. Note how on the right side of the chart, the RSI does not always enter the oversold area but sometimes comes out of it remaining just above it.
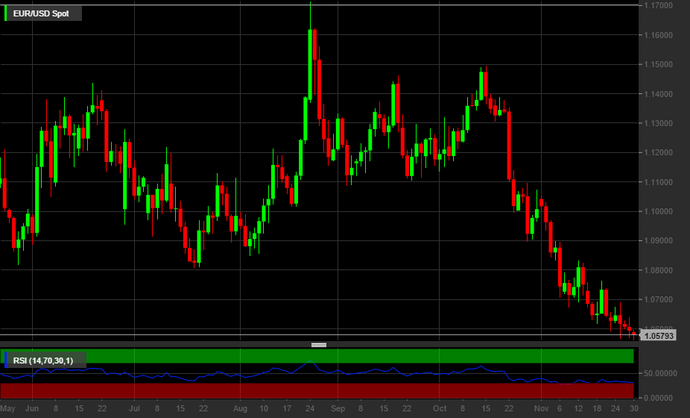
In cases like these, a trend reversal is generally difficult as the indicator signals the persistent weakness of the financial instrument being analyzed.
When the RSI values mark a peak in the overbought or oversold areas, there could instead be a rebound in price (as denoted by the maximum peak of the Euro-Dollar exchange rate in the chart below).

3. Average Directional Index (ADX)
The Average Directional Index (ADX) is a useful indicator to measure the strength and directionality of a trend. This indicator consists of 3 parts: ADX, +DM, and -DM.
This indicator is used to understand the strength of a trend - when this indicator assumes values above 25-30 it tends to indicate a strong ongoing trend. +DM and -DM are used in the same way as moving averages, when +DM is above -DM we are in the presence of a bullish signal, and vice versa in the opposite case.
By crossing all three components together, it will be possible to generate up or down signals with the relative strength of the trend.
The ADX is one of the most used indicators, however, it is very difficult to use it alone due to the ease of generating signals. Typically, the ADX is accompanied by more precise indicators such as the RSI or the MFI (if available).
In the following graph, it is possible to see how the ADX has generated a downward signal (marked with the white circle) in the Euro-Dollar exchange rate graph.
4. Bollinger Bands
Bollinger Bands are widely used in the world of financial markets. Being an indicator of volatility (since the bands measure the standard deviation of the price, i.e. the deviation of the quotation from the average price) they are a very useful tool in the currency market.
Rather than generating bullish or bearish signals, Bollinger Bands are used as dynamic resistance and support levels. In fact, generally, the upper band has the function of dynamic resistance while the lower band is from dynamic support. Many traders tend to position themselves on the levels of the bands to play on possible price rebounds.
The Bollinger Bands could be used on their own but it is always best to compare them to the moving average cross or the ADX indicator to allow you to get a better picture of the chart configuration at hand.
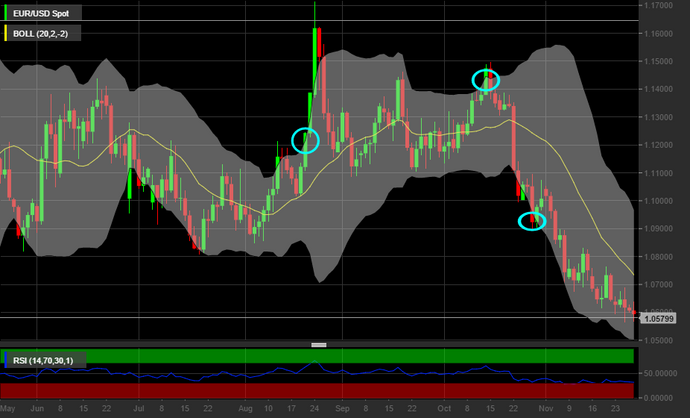
In the following graph, it is possible to see, from the blue circles, how the Bollinger bands can be used effectively as graphic support and resistance levels.
5. Moving Average Convergence/Divergence (MACD)
The Moving Average Convergence/Divergence (MACD) is composed of 3 main parameters corresponding to 3 moving averages of different periods. The periods generally taken into consideration are 12, 26, and 9.
The difference between the 12-period average and the 26-period average forms the MACD histogram while the 9-period moving average forms the signal line.
The MACD is used as a generator of signals that are interpreted through the crossing of the signal line with the histogram.
It is generally not used on its own as a technical analysis indicator but, more often than not, it is accompanied by more statistical indicators such as the RSI for example.
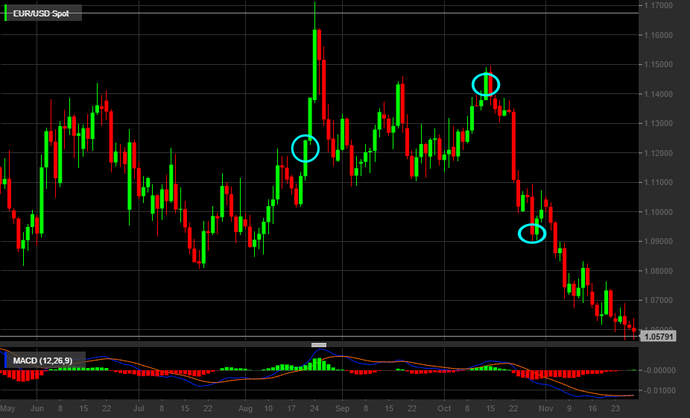
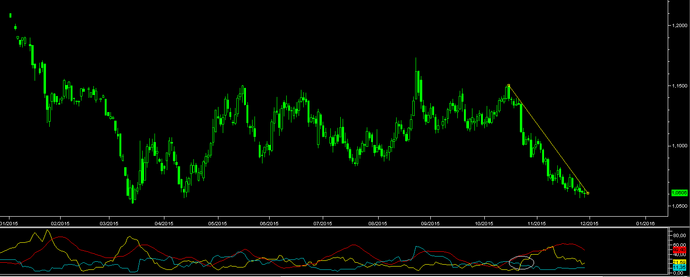
In this graph, it is possible to see how the MACD was able to successfully signal the breaking points of the trends that occurred in the EUR/USD exchange rate.
Original article published on Money.it Italy 2023-03-28 11:17:00. Original title: I 5 migliori indicatori di analisi tecnica per il trading
Argomenti


