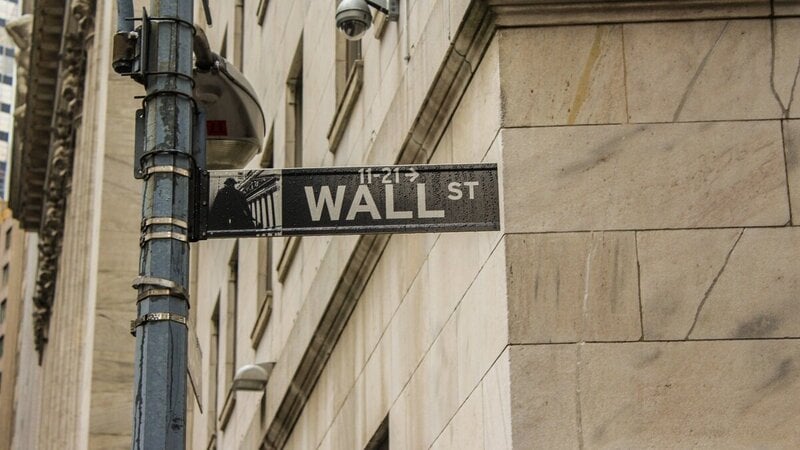
US stocks have slipped since October 6, 2026, when the Nasdaq Composite and S&P 500 closed at all-time highs, and the retreat has carried some indexes back close to their 200-day moving average, the line analysts watch to judge whether the long-term trend is holding. The Dow Jones had set its own record on August 5.
The Nasdaq Composite has shown the most weakness. For the others, the coming weeks will tell whether support holds.
Falling stocks have put US recession risk back on the table, and the inflation data just released makes the question more pressing.
US inflation beats expectations, labor market under scrutiny
US consumer prices rose 0.4% in October, a tenth of a point above the 0.3% economists had expected, according to figures the Bureau of Labor Statistics published on November 10. Core inflation, which strips out food and energy, showed the same gap, up 0.3% against a forecast 0.2%.
The headline figure slowed from September’s 0.6%. It remains an uncomfortable reading for the Federal Reserve. With prices running hotter than expected, the central bank has good reason to keep monetary policy restrictive, if not to raise rates further. Technology companies and more heavily indebted firms would bear the brunt.
Employment is the other front to watch. More unemployment and fewer hires would push the slowdown into consumer spending and, from there, into corporate earnings. To catch it early, market participants track the monthly Non-Farm Payrolls and the unemployment rate, along with the weekly jobless claims.
Then there is the Sahm Rule, which flags a recession when the three-month average of the unemployment rate rises at least half a point above the low that same average reached over the previous twelve months. A deteriorating labor market alongside high inflation would tie the Fed’s hands, because cutting rates to support the economy would become far more difficult.
US recession: the signals from Treasuries and the 200-day moving average
On activity, the threshold to watch is 50. Below that level, the ISM indexes for manufacturing and services point to contraction. A prolonged deterioration in the Conference Board’s Leading Economic Index and in the Atlanta Fed’s GDPNow estimates would be a further warning of a slowdown.
The Treasury curve is not sounding an alarm. On November 10, the yield on the 10-year note was above that on the 2-year, so there was no inversion. Historically, an inversion, with the 2-year yielding more than the 10-year, has preceded many US recessions. The rule has had its exceptions, and a normal curve is no guarantee against a slowdown.
Since 1950, the S&P 500 has spent roughly 71% of trading sessions above its 200-day moving average, according to a historical study by Signature, a division of Esquire Bank, which counted 213 downside breaks over the same period. Breaching the line has happened often and has not always marked the start of a crash. Two other things matter more: how long the index stays below the line, and whether the economy is deteriorating in the meantime.
For investors outside the United States holding funds or ETFs exposed to Wall Street, a fresh drop in US stocks would show up in portfolios immediately. The euro/dollar exchange rate adds a second risk: for anyone holding dollar-denominated US equity funds or ETFs from a non-dollar base currency, it can weigh on the final return of the investment.
Editor’s note
This article was originally published in Italian on money.it by Gerardo Marciano on November 15, 2026 as «Borsa USA, torna la paura della recessione. I tre segnali da Wall Street da tenere d’occhio». It has been translated and adapted for an international audience by the Money.it International desk.